Quality Analysis
Quality analysis scores the richness and completeness of your extracted knowledge graph. Use it to identify sources with weak extraction results and find opportunities for improvement.
Quality Grades
Each source receives a quality grade from 0-100:
| Grade | Label | Meaning |
|---|---|---|
| 85-100 | Outstanding | Excellent extraction with rich entities and relationships |
| 70-84 | Excellent | Strong extraction quality |
| 50-69 | Good | Solid extraction with room for improvement |
| 30-49 | Fair | Basic extraction, may benefit from re-processing |
| 0-29 | Low | Poor extraction quality |
Scoring Components
Quality scores are computed from multiple dimensions:
Entity Quality
Each extracted entity is scored on:
| Metric | What it measures |
|---|---|
| Description score | Richness of the entity description |
| Confidence score | LLM extraction confidence |
| Cross-chunk score | How many chunks mention this entity |
| Properties score | Number of properties extracted |
| Aliases score | Alternative names identified |
| Type value score | Entity type specificity tier |
Relationship Quality
Each extracted relationship is scored on:
| Metric | What it measures |
|---|---|
| Justification score | Richness of the relationship evidence |
| Confidence score | LLM extraction confidence |
| Specificity score | How specific the relationship type is |
| Valid refs score | Whether referenced entities actually exist |
Source-Level Metrics
Aggregated scores for the entire source:
| Metric | Description |
|---|---|
| Quality grade | Overall score 0-100 |
| Avg entity quality | Mean entity score |
| Avg relationship quality | Mean relationship score |
| Connectivity ratio | Ratio of entities with at least one relationship |
| Density ratio | Relationships per entity |
| Density score | Bell-shaped around target density (over-dense graphs are penalized) |
| Topology score | Combined connectivity and density |
| Coverage score | Entities per chunk (normalized) |
| Pollution penalty | Deduction for low-quality items (0-15) |
| Structural penalty | Deduction for graph-shape noise: hub skew + reciprocal rate (0-15) |
| Hub skew | max_entity_degree ÷ median_entity_degree (≥1.0; high = one entity over-connected) |
| Reciprocal rate | Fraction of edges with a same-type reciprocal partner (0-1) |
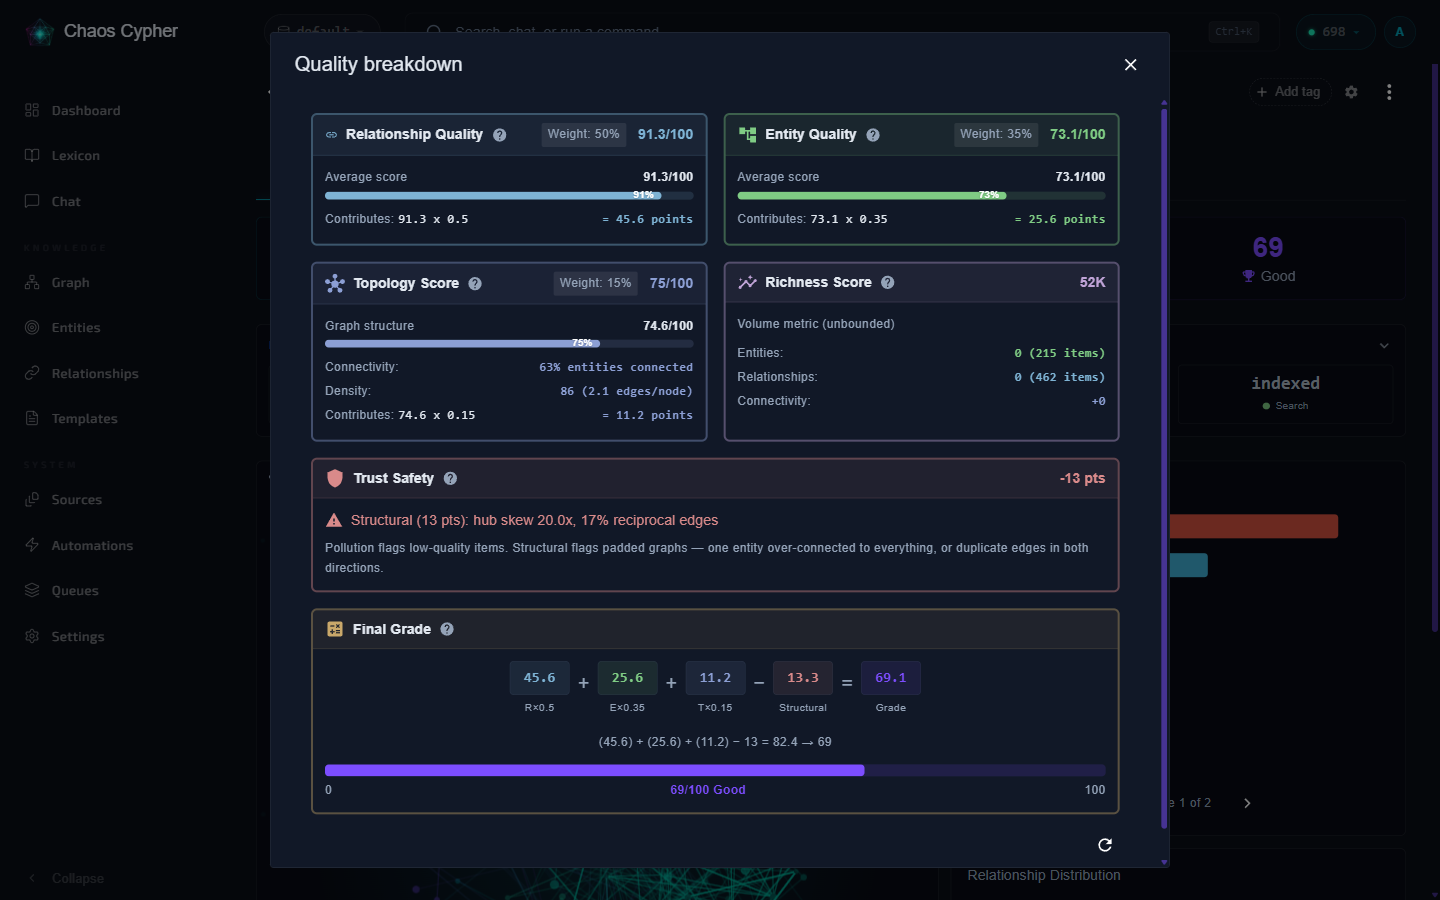
Final Grade Formula (v7)
When relationships exist:
Weighted Sum = (R × 0.50) + (E × 0.35) + (T × 0.15)
When entity-only (no relationships):
Weighted Sum = (E × 0.55) + (T × 0.45)
Final Grade = max(0, Weighted Sum − Pollution Penalty − Structural Penalty)
Where R = relationship quality, E = entity quality, T = topology score.
The Structural Penalty (new in v7) catches graphs where a chatty LLM padded the output: one entity ends up connected to everything (high hub skew), or the same relationship is emitted in both directions (high reciprocal rate). This stops verbose models from inflating the grade with redundant or inverted edges.
Using Quality Analysis
Score a Single Source
- Web UI
- CLI
- API
Open a source's detail view on the Sources page to see its quality score, grade label, and component breakdown.
# Basic score
chaoscypher source quality score SOURCE_ID

# With entity and relationship breakdowns
chaoscypher source quality score SOURCE_ID --details

# JSON output
chaoscypher source quality score SOURCE_ID --json
curl http://localhost:8080/api/v1/quality/sources/{source_id}
Detailed Breakdown
Get individual entity and relationship scores to identify specific weak points:
- Web UI
- CLI
- API
Click on the quality score in the source detail view to expand the detailed breakdown showing individual entity and relationship scores.
chaoscypher source quality score SOURCE_ID --details
curl http://localhost:8080/api/v1/quality/sources/{source_id}/details
Database Summary
Get an overview of quality across your entire database:
- Web UI
- CLI
- API
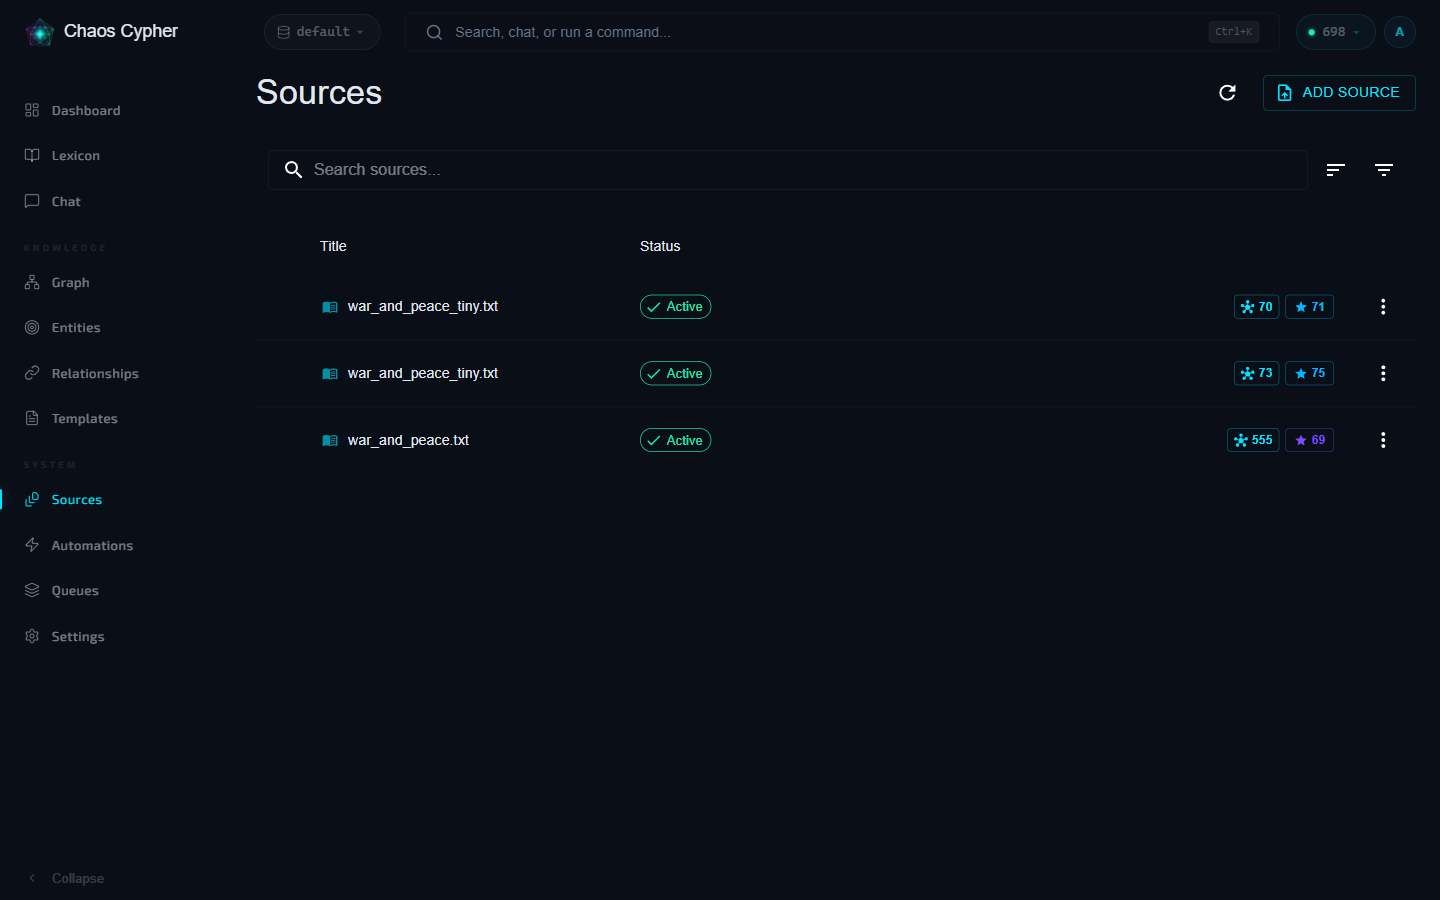
The Sources page shows quality grades inline for each committed source. Sort by quality to see the best and worst results.
# Analyze all sources with quality metrics
chaoscypher source quality analyze

# Sort by quality grade
chaoscypher source quality analyze --sort quality

# Filter by domain
chaoscypher source quality analyze --domain technical
curl http://localhost:8080/api/v1/quality/summary
Batch Analysis
Score multiple sources at once with filtering and sorting:
- CLI
- API
# Full quality report
chaoscypher source quality report

# Export as JSON
chaoscypher source quality report --format json -o quality.json

# Include domain comparison
chaoscypher source quality report --include-domains
curl "http://localhost:8080/api/v1/quality/analyze?sort_by=total_score&sort_order=asc"
Domain Comparison
Compare quality metrics across extraction domains:
- CLI
- API
chaoscypher source quality report --include-domains
curl http://localhost:8080/api/v1/quality/domains
Score Caching
Quality scores are cached on the source record after extraction completes. Cached scores include a version number to detect when the scoring algorithm has been updated.
Recalculate Scores
Force recalculation when scores are outdated or after algorithm updates:
- CLI
- API
# Recalculate all sources
chaoscypher source quality recalculate

# Only recalculate outdated scores
chaoscypher source quality recalculate --outdated-only

# Recalculate specific sources
chaoscypher source quality recalculate -s SOURCE_ID

# Filter by domain
chaoscypher source quality recalculate --domain technical
curl -X POST http://localhost:8080/api/v1/quality/recalculate
Find Outdated Scores
Check which sources have missing or outdated cached scores:
- API
curl http://localhost:8080/api/v1/quality/outdated
Pipeline flow counters
The Quality grade scores how good the extracted graph is. The Pipeline flow section — a collapsible panel on the source detail page's Overview tab — records what the pipeline silently dropped, deduplicated, or merged on the way to that graph.
Expand the Pipeline flow panel to see a per-stage counter board with a counter for every silent-drop site across all pipeline stages — loading, normalization, chunking, LLM extraction, post-extraction, and commit. For the full list and per-counter semantics, see the Pipeline flow & quality counters page.
When the grade is surprisingly low, the counters usually tell you why
— a huge cleaner_lines_removed means the document was mostly OCR
noise; a huge relationships_dropped_capped means the LLM tripped the
relationship safety nets.
Counters reset to zero on Re-extract, so you can compare the new run
against the old one. The Quality grade is recomputed and persisted
separately — it doesn't reset.
For the full counter reference, see the Pipeline flow & quality counters page.
Improving Quality
Based on quality analysis, consider these strategies:
- Low entity quality — Try re-extracting with
fulldepth or a different domain - Low connectivity — Check if entities are too fragmented; consider different chunking settings
- Low coverage — Documents may need larger chunk groups for better context
- High pollution — Many low-quality entities; consider higher confidence thresholds in source processing settings
- High hub skew — One entity dominates the graph. Usually means the LLM anchored hallucinated edges on a memorable entity; try a different model or extraction depth
- High reciprocal rate — LLM emits the same relationship in both directions (often one is inverted). Try a model with stronger directional reasoning